Take Landscape
Variance
Off Your
Quarterly Variance
Calls
Landscape should be the most predictable controllable line on the OpEx breakout. Across most multi-property portfolios in South Florida, it’s the highest-variance. The fix is structural – and we’re built for it.
📞 +1 (561) 309-9603Add Us To Your Bid List!
±22%→±5%
YoY Landscape Variance (11-property REIT)
132→12
Annual AP Invoices After Consolidation
$87K→$0
Plant Replacement Variance Year I
$1.42M→$1.31M
Aggregate Portfolio Spend
Multi-Property Landscape Management for Portfolio Managers and REITs in South Florida
If you manage a multi-property commercial portfolio in South Florida and you have ever sat through a quarterly review where the longest discussion was the landscape line, this page is for you. The landscape budget should be the most predictable controllable expense in commercial real estate. Recurring scope, scheduled visits, minimal year-over-year variance. And yet across most portfolios it is the highest-variance line on the OpEx breakout — usually because each property in the portfolio is on a different vendor, with different scope definitions, different reporting (or none), and different invoice cadences. The variance is structural, not operational.

Green Image Landscaping is the South Florida landscape company built for multi-property portfolios. We service multi-property clients across Broward, Palm Beach, and northern Miami-Dade with standardized scope, standardized reporting that rolls up to your asset-level dashboards, and the lifetime plant guarantee extended portfolio-wide. This page covers why landscape variance is a portfolio-level problem, how a single-vendor consolidation actually works, and the year-end numbers from an 11-property regional REIT consolidation that took landscape OpEx variance from ±22% to ±5% in one fiscal year.
Why Landscape Is the Highest-Variance Controllable OpEx Line in Most Portfolios
Three structural drivers create the variance. They compound across a multi-property portfolio in ways they do not at a single property.
Pricing fragmentation across vendors. If your portfolio has 8 properties across 4 incumbent landscape vendors, you have 4 pricing models, 4 scope definitions, and 4 invoice cadences. Volume pricing on labor, plant material, and mulch is impossible because you have no volume at any single vendor — you have one-off contracts at each. Industry data and our own portfolio clients show 3% to 7% raw cost reduction available from consolidation alone, before any scope optimization.
Scope inconsistency. Vendor X mulches every 8 weeks. Vendor Y mulches every 12. Vendor Z mulches “as needed,” which is whatever the foreman remembered. Each vendor’s idea of “standard pruning” is different. Each vendor handles seasonal color differently. The PM at each property has a different relationship with their vendor and a different threshold for “this is in scope” versus “this is a change order.” The asset team sees the aggregate variance and cannot trace it to a single root cause because the root cause is structural.
Plant replacement spikes. The largest single variance driver in commercial landscape OpEx is plant replacement. Across a multi-property portfolio, the spikes are uncorrelated — a hibiscus die-off at one property, a queen palm replacement at another, an entrance bed refresh at a third. Each one is small. Aggregated, they create a sawtooth pattern in the landscape line that asset management hates because it cannot be forecast. The plant replacement variance line is a function of who installed the plants, how they were watered, and whether the vendor’s incentive structure pays them more when plants die or less.

All three drivers are solvable through vendor consolidation under a standardized scope and a structured plant guarantee. The math is straightforward. The execution is where most consolidations fail — which is what the rest of this page is about.
More Services
How Multi-Property Landscape Consolidation Actually Works
If you are evaluating consolidating landscape across a multi-property portfolio, here is the framework. Same framework we recommend whether or not we are the consolidating vendor.
Audit the Current State
Pull the last 24 months of landscape spend across the portfolio. Break it down by property and by vendor. Separate the recurring contract line from the supplementary invoices. Calculate the variance percentage at the property level and at the portfolio aggregate level. Identify which properties are running consistently over budget and which vendors are generating the largest supplementary invoice line. The audit takes a week of an asset associate’s time and produces the baseline you need for any consolidation case. We provide an audit template on request, regardless of whether you consolidate to us.
Time the Transitions
Most consolidation efforts fail because the asset team tries to switch all properties at once and underestimates the contract complexity. Existing landscape contracts have notice periods (usually 60 to 90 days), some have termination penalties, some are co-terminous with anchor tenant leases. Build a 9-to-12-month phased transition schedule. Properties with contracts expiring naturally go first. Properties with the largest variance issues go second. Properties under long-dated contracts with penalty clauses go last and are negotiated out individually.
Standardize the Scope
This is the step most consolidations skip and the step that drives most of the variance reduction. Build one standardized scope template and apply it to every property in the portfolio. Same line items. Same frequencies. Same exclusion language. Same reporting cadence. Property-specific variations are documented as exhibits to the master scope, not as separate scopes. The standardized scope makes property-level performance comparable, makes invoice review fast, and eliminates the “each property is different” excuse vendors use to justify supplementary work.
Consolidate the Reporting
Define one reporting format for the entire portfolio. Monthly property-level service report, monthly aggregated portfolio summary, quarterly business review covering all properties together. The reporting should drop into your asset-level dashboards without translation. The asset team should be able to see landscape performance across the portfolio in the same view as occupancy, NOI, and tenant retention. Most landscape vendors cannot produce reporting at this level. The ones that can are the ones that win portfolio consolidations.
Structure the Plant Guarantee
Negotiate a portfolio-wide plant guarantee structure. Plants installed under the maintenance contract should be replaced at vendor cost if they die under continuous maintenance. The guarantee should apply across all properties, transfer with the maintenance contract, and not require property-by-property approval for replacements. This single structural change is what eliminates the largest variance line in the landscape OpEx category.
Single Point of Accountability
One named account manager for the entire portfolio. Not a property-level lead per property — one account manager whose job is the asset team’s relationship across all properties. Property-level account leads exist underneath that person, but the portfolio relationship lives with one human who attends the asset reviews, presents the QBRs, and is on the phone when something goes sideways at any property. If the consolidation vendor cannot commit to a named portfolio account manager, the consolidation will not deliver the operational simplicity that justifies it.
Most Commercial Bids Wreck the CO Date. You don’t find out until inspection day.
The cheap landscaping number wins the bid. Weeks later the irrigation fails inspection, sod dies on pallets, plant substitutions get flagged, and the CO date starts slipping.
We created this field guide to help commercial GCs, PMs, and supers identify the warning signs before awarding the wrong landscape contractor.
The hidden $100K-to-$200K cost cascade behind cheap landscape bids
GC-grade RFP template and 50-point evaluation scorecard
The 9-step sequencing framework that protects your CO date
10 red flags that predict failed inspections and change orders
Closeout walkthrough checklists and binder templates for commercial projects

Get The Guide
Drop your email below and we’ll send the PDF instantly.
Three Things We Do That Most Multi-Property Landscape
Vendors Do Not
Plants for Life — Portfolio-Wide
The lifetime plant replacement guarantee that anchors our HOA and commercial work extends portfolio-wide for multi-property accounts. Plants installed across any property in the portfolio are covered. Replacements happen at our cost without invoice. The plant replacement variance line on your portfolio OpEx breakout goes to zero — and stays there. On the 11-property REIT case study below, this single line item moved from $87K in the prior year to $0 in year one.
Single Account Manager + Standardized Reporting
One named account manager for the entire portfolio. Standardized monthly property reports, aggregated portfolio summary, quarterly business review covering all properties. Reporting designed to drop into asset-level dashboards. The asset team sees landscape across the portfolio the same way they see occupancy or NOI — one view, one cadence, one accountable human.
Transparent Estimating Across the Portfolio
Every property gets the same standardized scope template. Same line items. Same frequencies. Same exclusion language. Property-specific exhibits handle the variations. The asset team can compare property-level performance, vendor performance against bid, and year-over-year trend without having to reconcile different scope formats. The format has been the same since 2018.
How We Onboard a Multi-Property Portfolio
Step 1 — Portfolio Audit
We meet with your asset team. We review your current landscape spend across the portfolio (you provide the data), document the current vendor-by-property structure, and identify the variance pattern. We deliver a written portfolio audit — typically 12 to 20 pages — within 15 business days. The audit costs you nothing whether you consolidate to us or not.
Step 2 — Phased Transition Plan
Based on the audit, we propose a phased transition schedule that respects your existing contract notice periods and minimizes service gaps. Typical portfolios transition over 6 to 12 months. We do not push for faster transitions than the contract structure allows.
Step 3 — Standardized Scope
We build the master scope template specific to your portfolio’s property types and asset class. Each property gets its specific exhibit. The asset team reviews the master scope and the exhibits before we move to property walks.
Step 4 — Property Walks and Onboarding
Each property gets a walk before transition. Each property gets the first-month reset visit at no scope upcharge. Each property gets its named account lead. The portfolio account manager is named and introduced to your asset team at kickoff.
Step 5 — Service, Report, Stay Close
Service runs on the standardized scope. Reports land monthly. The portfolio account manager presents the QBR every quarter to your asset team. We attend asset reviews on request. We escalate proactively across the portfolio — if a tree is hazardous at one property, we do not wait for that property’s review cycle.
Multi-Property Landscape Services for Portfolio Managers and REITs

Portfolio-wide grounds maintenance
standardized scope across all properties
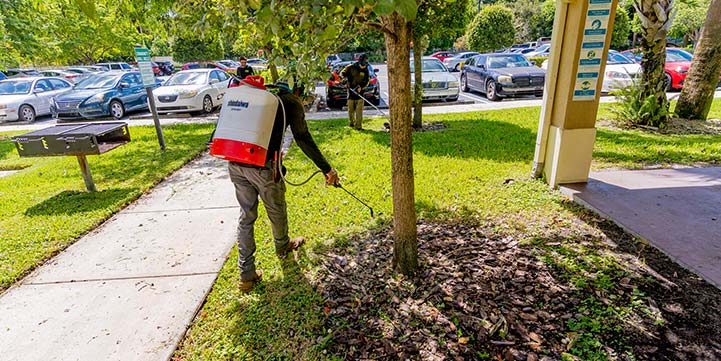
Plant Health Care
fertilization, integrated pest management, disease diagnostics, portfolio-wide

Capital project landscape work
entrance refreshes, common area renovations, courtyard installs across properties as scheduled

Sod replacement programs
multi-property phased sod replacement on standardized cycles

Irrigation diagnostic and upgrade
portfolio-wide irrigation audit and standardized smart controller deployment

Drainage corrections
across properties as identified during onboarding audits

Tree services
pruning, hurricane prep, ISA Certified Arborist consultation across all properties
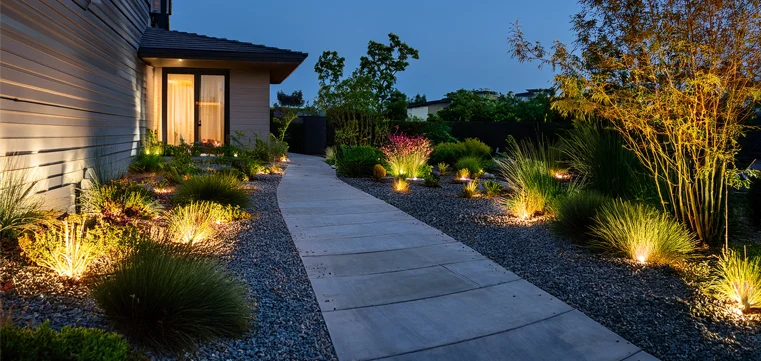
Landscape lighting
design, installation, multi-property low-voltage upgrade programs
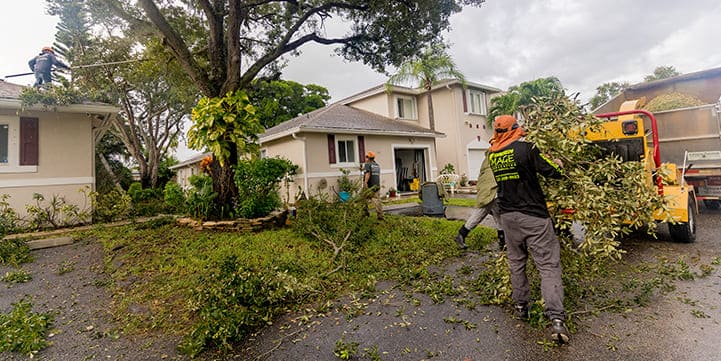
Storm response
pre-positioned crews and equipment for portfolio clients, priority dispatch, FEMA-eligible documentation
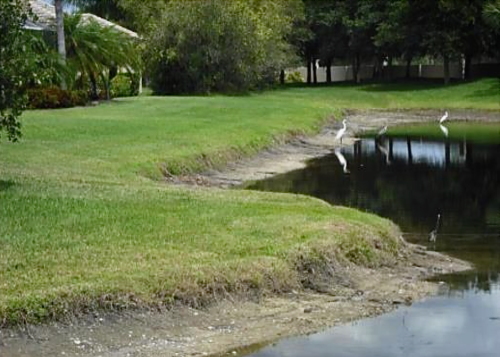
Erosion control and shoreline stabilization
for properties with retention ponds or water bodies; delivered through our Shoreline Erosion Control division

ESG and sustainability reporting support
water use tracking, chemical input tracking, native species substitution where appropriate
Case Studies — Multi-Property Portfolios We Manage
Anonymized for client privacy. Numbers and circumstances are accurate. Asset team references with full portfolio details available on request.
The 11-Property REIT Consolidation
Regional Grocery-Anchored Portfolio
Setup
Regional grocery-anchored REIT. 11 Florida properties — 7 in Broward and Palm Beach, 4 in Miami-Dade. Four incumbent landscape vendors across the portfolio. Asset team’s three goals: OpEx variance reduction, single point of contact, standardized reporting that drops into investor decks.
Complication
Three of the four incumbent vendors were locked into 18-month renewals. Transition had to be phased. No room for a service gap at any property — anchor tenants on co-tenancy clauses across multiple sites.
Approach
Q1 2024 transition plan, phased over 9 months. Standardized scope across all 11 properties — same line items, same frequencies, same reporting cadence. Lifetime plant guarantee extended portfolio-wide. Single account manager assigned to the asset team, with monthly QBR rolling all 11 properties into one report.
Result
Aggregate landscape line: $1.42M to $1.31M, a 7.7% reduction. OpEx variance: ±22% YoY to ±5% YoY. Tenant complaint emails citing grounds: down 71%. AP invoices processed annually: 132 to 12. Plant replacement variance line: $87K in the prior year to $0.
The 6-Property Office Portfolio
Asset Management Firm
Setup
An asset management firm overseeing 6 Class B office properties across Broward and Palm Beach consolidated landscape from 3 vendors to Green Image at the start of FY24. Goals: stop the property managers from each fielding their own vendor disputes, get consistent reporting across all 6 properties, eliminate the recurring “supplementary work” invoices that landed unpredictably each quarter.
Approach
Phased 6-month transition. Standardized scope across all 6 properties. Single QBR replacing the prior 6 separate vendor reviews. Lifetime plant guarantee extended portfolio-wide. Reporting designed to plug into the firm’s existing asset dashboards.
Result
After 12 months: zero supplementary invoices outside scope versus 31 the prior year. Single QBR replacing 6 separate vendor reviews. Asset-level dashboards showing landscape as a flat line rather than a sawtooth. The firm’s Director of Asset Services was promoted to VP that year and cited “vendor consolidation” as one of three top initiatives in his promotion case. The lifetime plant guarantee saved the portfolio an estimated $34K in plant replacements that would have otherwise hit Q3 — a quarter where two of the properties were also undergoing capital improvements and additional variance would have triggered re-forecasting.
Frequently Asked Questions
From
Portfolio Managers and Asset Teams
How many properties is your portfolio book at the moment?
We service multiple multi-property accounts in South Florida ranging from 4 to 14 properties under single management. The largest single portfolio under our management is 14 commercial properties. Our crew structure scales to portfolios up to roughly 25 properties without needing to add a second portfolio account manager — beyond that we add infrastructure rather than stretch the existing team.
What is the typical fee structure for a multi-property consolidation?
Recurring contracts price per property using the standardized scope template. Aggregate portfolio savings come from three sources: raw cost reduction from volume pricing (typically 3% to 7% on the recurring contract line), elimination of supplementary invoices through standardized scope and the plant guarantee structure (typically 60% to 90% reduction in supplementary invoice volume), and reduced internal overhead from consolidated AP and reporting (132-to-12 invoice ratio in the REIT case study). The total portfolio savings versus pre-consolidation baseline typically runs 8% to 12% in year one.
Can you handle properties of different asset classes in the same portfolio?
Yes. Our portfolio book includes mixed-asset portfolios spanning Class A office, Class B office, neighborhood retail, anchor-tenant retail, and industrial. The standardized scope template handles the variation through property-specific exhibits — the master scope is consistent, and each property’s exhibit captures the asset-class-specific finish standards.
How do we transition without service gaps?
Transitions are phased over 6 to 12 months based on existing contract notice periods. We coordinate the handoff with each incumbent vendor, including chemical schedule continuity, irrigation programming transfer, and equipment/supplies removal. We have not had a service gap on any portfolio transition we have run.
Are you licensed and insured for multi-property work?
Yes. State pesticide applicator certifications under FDACS, Certified Irrigation Contractor on staff, ISA Certified Arborist on staff, $2M General Liability aggregate, Workers Compensation on every employee, $1M Commercial Auto. COIs naming each property and the management firm available before transition. License numbers verifiable on the public registry.
How does the plant guarantee work across a portfolio?
The lifetime plant guarantee extends to every property in the portfolio under the maintenance contract. Plants we install across any property are covered — replacements happen at our cost without separate invoice. Voids only on third-party damage, owner-disabled irrigation against our written recommendation, or contract lapse. The guarantee is the structural mechanism that takes the plant replacement variance line to zero across the portfolio.
What does the reporting look like?
Three layers. Property-level: monthly written service report with photos, delivered to the property’s PM. Portfolio-level: monthly aggregated summary delivered to the asset team. Strategic: quarterly business review covering all properties, presented to the asset team. Reports designed to drop into asset-level dashboards and investor letter formats. Sample reports available on request.
Can you support ESG and sustainability reporting?
Yes. We track water use, chemical input, native species composition, and waste diversion across portfolio properties. The data feeds into our standard reports and can be formatted for ESG disclosure frameworks (GRI, GRESB, TCFD) on request. We also actively recommend native species substitutions where appropriate to reduce water and chemical input — particularly relevant under tightening Florida water management district guidance.
What happens during hurricane season for portfolio clients?
Pre-storm: crews and equipment pre-positioned 72 hours ahead of expected impact, after-hours dispatch line activated, pre-storm property walks documented for FEMA eligibility. Post-storm: mobilization within 24 hours of all-clear with priority dispatch for portfolio contract clients. Triage hierarchy across the portfolio prioritizes hazardous trees and access blockages first, debris cleanup second. Documentation suitable for FEMA reimbursement claims is delivered for retail and mixed-use clients across the portfolio.
Where in South Florida do you service portfolios?
Broward, Palm Beach, and northern Miami-Dade. Properties in Boca Raton, Delray Beach, Boynton Beach, Wellington, West Palm Beach, Palm Beach Gardens, Jupiter, Coral Springs, Parkland, Pompano Beach, Plantation, Weston, Pembroke Pines, Hollywood, Aventura, and Doral. For portfolios extending outside that footprint, ask — we extend for the right account.
Where We Service Multi-Property Portfolios
Green Image services multi-property portfolios throughout Broward and Palm Beach County, with selective coverage in northern Miami-Dade. Crews based in Boca Raton with route density across:
- Boca Raton
- Delray Beach
- Boynton Beach
- Wellington
- West Palm Beach
- Palm Beach Gardens
- Jupiter
- Coral Springs
- Parkland
- Pompano Beach
- Plantation
- Weston
- Pembroke Pines
- Hollywood
- Aventura
- Doral
- + Surrounding areas
Local route density across a portfolio’s footprint is what makes single-vendor consolidation operationally viable — a vendor with crews 90 minutes away from half your properties cannot deliver the response time portfolio-level standards require.
Have Alex Reach Out
If you manage a multi-property commercial portfolio in South Florida and are evaluating landscape consolidation, Alex from our team will run the portfolio audit and put a written consolidation proposal in your hands. No charge for the audit. No pressure on the consolidation.
Portfolio-wide lifetime replacement guarantee that takes the largest variance line to zero
One accountable human across the portfolio, reports that drop into asset dashboards
Same standardized scope template across every property, comparable line by line